In an image, an object or a portion can be segmented from the rest of the image by considering its color. From the image below, the green cap was the one to be segmented.
The Region of Interest (ROI) that was picked from the image is shown below
Using Scilab, the red, green and blue channel or component of the image is separated. The raw RGB values were transformed to its normalized chromaticity coordinates (NCC) using the equations below
where I = R+G+B is the intensity value of the color.
Parametric Probability Distribution Estimation
Each pixel of the ROI has its rgb chromaticity values. This segmentation makes use of the mean and standard deviation of the rgb chromaticity values of the ROI. The probability of each image pixel with chromaticity r that belongs to the color distribution of the ROI is defined by
similar equation is done for the probability having chromaticity g.The joint probability results to the final segmented image, which for our image is shown below.
Non-parametric Probability Distribution Estimation
Non-parametric segmentation is done by getting the value of each pixel of the ROI. The values were plotted in the 2D histogram. A certain color has its certain location in the NCC color space. The 2D histogram of our ROI is represented below. The white patch in the histogram was observed to agree with the desired location of the green in the NCC space.
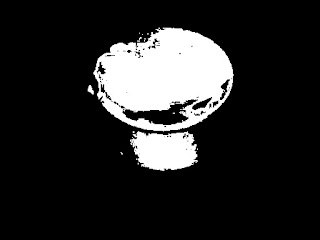
The 2D histogram was used to backproject the values to the whole image. The value of each pixel of the image were located in the histogram and whatever the values in that location will be the value replaced in that pixel. The result of the non-parametric color segmentation is as follows.
For both of the color segmentation, however, not the entire cap was segmented. The portion that was not segmented were the darker shades of green. Making the ROI cover a bigger area to better represent the color, especially those of lower brightness, the figure below shows the new ROI and its corresponding 2D histogram.
The output of the parametric and non-parametric color image segmentation is as follows. It was observed that when the ROI is made bigger, which better represents the all the shades of color of a region, the segmentation is improved.
 |
| Output of parametric (left) and non-parametric (right) color image segmentation |
Let's try for other picture :)
I try to isolate each color..
This technique really have amazing results. The upper set is the parametric while the lower set is the non-parametric color image segmentation.
In my outputs, it was observed that non-parametric segmentation better and cleaner segmentation. Also, it is faster since no computations of mean, standard deviation and probabilities were need to do the segmentation.
I give myself a 11/10 for accomplishing the desired result. Additional points for trying to make the ROI bigger and applying the segmentation is many other objects.
[1] Soriano, M. "Color Image Segmentation." AP 186 Laboratory Manual. National Institute of Physics, University of the Philippines, Diliman. 2013.


No comments:
Post a Comment